TL;DR — Quick Summary
Core Web Vitals (LCP ≤ 2.5s, INP ≤ 200ms, CLS ≤ 0.1) are Google ranking signals measured from real Chrome users at the 75th percentile over 28 days. Quick wins: 1) Preload your LCP image with fetchpriority='high' and convert to WebP/AVIF. 2) Defer all non-critical JavaScript and break Long Tasks with yield patterns. 3) Add explicit width/height to every image and video. 4) Use font-display: swap with size-adjusted fallback fonts. 5) Audit and defer third-party scripts (analytics, chat widgets, social embeds). 6) Enable a CDN with proper cache headers (TTFB under 800ms). 7) Monitor with CrUX field data, not just Lighthouse lab scores. 8) Prioritize mobile — it's what Google primarily uses for ranking. These eight steps alone can move most sites from 'poor' to 'good' within one 28-day CrUX cycle.
Key Takeaways
- ✓Core Web Vitals are confirmed Google ranking signals — pages passing all three metrics receive a measurable ranking boost in competitive SERPs.
- ✓LCP (loading), INP (responsiveness), and CLS (visual stability) each require different optimization strategies — fix LCP first for maximum impact.
- ✓Google uses the 75th percentile of real-user field data from CrUX over a 28-day rolling window — lab scores are for debugging only.
- ✓Only 42% of mobile origins pass all three CWV thresholds in 2026 — optimization is a significant competitive advantage.
- ✓E-commerce sites see 8% conversion improvement per 100ms LCP reduction; publishers see 24% fewer abandonments when passing CWV.
- ✓Platform-specific fixes differ dramatically — WordPress needs plugin/theme optimization, Shopify needs app auditing, React needs code splitting.
- ✓Advanced techniques like HTTP/3, partial hydration, Speculation Rules API, and edge rendering can push performance beyond basic thresholds.
- ✓Monitor continuously with RUM tools and Google Search Console — CWV is not a one-time fix but an ongoing practice.
What Are Core Web Vitals & Why Optimize Them?
Core Web Vitals (CWV) are a set of three user-centric performance metrics that Google uses as ranking signals to evaluate real-world page experience. First introduced in May 2020, they became an official Google ranking factor in June 2021 as part of the Page Experience Update and were significantly updated in March 2024 when INP replaced the original First Input Delay (FID).
The three metrics measure distinct aspects of user experience:
- •LCP (Largest Contentful Paint) — Loading performance: when the largest visible content element finishes rendering
- •INP (Interaction to Next Paint) — Responsiveness: how quickly the page responds to user interactions
- •CLS (Cumulative Layout Shift) — Visual stability: how much visible content shifts unexpectedly during the page visit
Google evaluates CWV using field data from real Chrome users, aggregated in the Chrome User Experience Report (CrUX). The data is collected over a rolling 28-day window at the 75th percentile — meaning 75% of your actual visitors must experience 'good' scores for the page to pass.
The evolution of CWV reflects Google's deepening commitment to user experience as a ranking factor. The original 2020 trio (LCP, FID, CLS) was refined when Google recognized that FID only measured the first interaction, missing the many subsequent interactions users have with a page. INP, which replaced FID in March 2024, measures all interactions throughout the page lifecycle, making it a far more comprehensive responsiveness metric.
In 2026, CWV remain among the most important technical SEO factors. While content quality is still the primary ranking signal, CWV act as a tiebreaker in competitive SERPs — and in industries like e-commerce, finance, and healthcare, that tiebreaker can mean the difference between page one and page two.
Rankings Impact
Since the June 2021 Page Experience Update, Core Web Vitals have been a confirmed ranking factor in Google Search. Google has stated explicitly that when two pages have similar content relevance, the page with better CWV will rank higher.
In practice, studies by Searchmetrics, Sistrix, and Ahrefs found that pages passing all three CWV thresholds saw an average ranking improvement of 1–3 positions. While this may seem modest, in competitive SERPs where the top 10 results have similar content quality, a 1–3 position improvement can mean a 30–50% increase in organic click-through rate.
Google Search Console now prominently displays CWV pass/fail status for all indexed pages, making it a key metric in performance audits. The CWV report groups pages by similar URL patterns and shows the percentage passing each metric, allowing you to prioritize optimization efforts on the highest-traffic templates.
Conversion & Revenue Correlation
The business case for CWV optimization extends well beyond rankings. Multiple large-scale studies have documented the direct relationship between page performance and business outcomes:
- •Vodafone improved LCP by 31% and saw a 15% increase in sales
- •NDTV reduced LCP by 55% and saw 50% lower bounce rates
- •Akamai research shows that a 100ms delay in load time can decrease conversion rates by 7%
- •SpeedCurve found that sites with 'good' INP scores see 22% more page views per session
- •Google's own research shows 24% fewer page abandonments on sites passing all CWV
For e-commerce sites processing $100K/month, improving CWV from 'poor' to 'good' can translate to $8K–$15K in additional monthly revenue. CWV optimization also reduces Google Ads cost-per-click — Google factors landing page experience (including CWV) into Quality Score, meaning faster pages pay less per click. We've seen clients reduce CPC by 12–18% after passing CWV thresholds.
Industry Benchmarks
CWV performance varies significantly by industry. According to 2026 CrUX data:
- •Media/Publishing: 48% pass rate (high ad density hurts CLS and INP)
- •E-commerce: 38% pass rate (heavy product images hurt LCP, complex JS hurts INP)
- •SaaS/Technology: 52% pass rate (JS-heavy SPAs hurt INP)
- •Healthcare: 44% pass rate (compliance scripts add weight)
- •Financial Services: 41% pass rate (security and compliance overhead)
- •Real Estate: 35% pass rate (heavy image galleries, map embeds)
These benchmarks matter because Google evaluates CWV relative to your competitive landscape. If your competitors are all failing CWV and you pass, the ranking advantage is significant. Conversely, in industries with high pass rates (like technology blogs), CWV becomes table stakes rather than a differentiator.
Understanding the Metrics: LCP, INP, CLS in Detail
Each Core Web Vital measures a distinct dimension of user experience. Understanding exactly what each metric captures — and doesn't capture — is essential for effective optimization.
Largest Contentful Paint (LCP) measures when the largest visible content element in the viewport finishes rendering. The LCP element is typically a hero image, video poster, large text block, or background image painted via CSS. LCP does NOT measure when the entire page finishes loading — only when the single largest element is visible. Target: ≤ 2.5 seconds from navigation start.
What counts as LCP: <img> elements, <video> poster images, elements with background-image via CSS, block-level elements containing text nodes. What doesn't count: elements with opacity: 0, full-viewport background images used as backgrounds rather than content, placeholder/skeleton elements.
Interaction to Next Paint (INP) measures the responsiveness of your page to user interactions throughout the entire page lifecycle. Unlike FID (which only measured the first interaction), INP considers all clicks, taps, and keyboard inputs, then reports the worst interaction (with some outlier handling). Target: ≤ 200 milliseconds.
INP is calculated as: Input delay + Processing time + Presentation delay. Input delay is time the main thread is busy when the user interacts. Processing time is the event handler execution. Presentation delay is the time to render the next frame after the handler completes.
Cumulative Layout Shift (CLS) measures the total of all unexpected layout shift scores that occur during the entire lifespan of the page. A layout shift occurs when a visible element changes its position from one rendered frame to the next without being triggered by user interaction. Target: ≤ 0.1.
CLS uses a 'session window' approach: layout shifts are grouped into windows with a maximum of 5 seconds and a 1-second gap between shifts. The CLS score is the maximum session window score. This means a single burst of shifts (like during an ad loading) is weighted more heavily than many tiny, spread-out shifts.
2026 Thresholds & the 75th Percentile Rule
The CWV thresholds have remained unchanged since their 2020 introduction:
- •LCP: Good ≤ 2.5s | Needs Improvement 2.5–4.0s | Poor > 4.0s
- •INP: Good ≤ 200ms | Needs Improvement 200–500ms | Poor > 500ms
- •CLS: Good ≤ 0.1 | Needs Improvement 0.1–0.25 | Poor > 0.25
The critical detail most site owners miss: Google evaluates CWV at the 75th percentile (p75) of real-user data. This means that even if your median (50th percentile) scores are 'good,' your page can still fail if the bottom quartile of visitors have poor experiences. This is why testing on your own fast developer machine gives misleading results — you need field data from diverse devices and networks.
Device differences matter enormously. Mobile CWV scores are typically 2–3x worse than desktop due to slower processors, constrained memory, and variable network conditions. Google primarily uses mobile data for ranking in mobile search results (which account for 60%+ of all searches). Always prioritize mobile optimization.
How to Measure & Audit Core Web Vitals
Effective CWV optimization requires understanding both field data (real users) and lab data (simulated tests). They serve different purposes:
Field Data (what Google uses for ranking): Field data captures CWV from actual Chrome users visiting your site. It's aggregated in the Chrome User Experience Report (CrUX) and reflects real-world conditions: diverse devices, networks, geographies, and browsing contexts. Field data is what determines your ranking signal.
Key field data tools:
- •Google Search Console — CWV report shows pass/fail for all indexed pages
- •PageSpeed Insights — Shows CrUX field data alongside Lighthouse lab data
- •CrUX Dashboard — Historical trends in Data Studio
- •CrUX API — Programmatic access for bulk monitoring
Lab Data (what you use for debugging): Lab data simulates a page load in a controlled environment with consistent device and network settings. It's reproducible and provides detailed performance traces, making it invaluable for diagnosing issues.
Key lab tools:
- •Lighthouse (in Chrome DevTools) — Full audit with actionable recommendations
- •WebPageTest — Advanced waterfall analysis, filmstrip comparison, multi-location testing
- •Chrome DevTools Performance panel — Frame-by-frame execution traces
How to interpret results: Always check field data first (PageSpeed Insights → 'Discover what your real users are experiencing'). If field data shows failures, use lab tools to diagnose the specific causes. Don't celebrate passing lab scores if your field data is still failing — they measure different things.
Struggling with Core Web Vitals speed?
Our team optimizes Core Web Vitals sites for real-world results. Request an audit.
Common Audit Mistakes
- 1Only checking desktop scores — Mobile is typically 2–3x worse and is what Google primarily uses for ranking
- 2Relying solely on Lighthouse — Lab conditions don't match real-world user experiences; field data determines rankings
- 3Testing a single page — Google evaluates CWV at both URL and origin level; check your top 20 pages
- 4Ignoring the 28-day window — A one-day fix won't immediately reflect in CrUX data; plan for the lag
- 5Testing on fast dev machines — Use Chrome DevTools throttling (4x CPU slowdown, Slow 3G) to simulate real users
- 6Not segmenting by device — A page might pass on desktop but fail on mobile
- 7Confusing lab INP with field INP — Lab tools measure Total Blocking Time (TBT) as an INP proxy; real INP depends on actual user interactions
- 8Ignoring third-party script impact — Analytics, chat widgets, and ad scripts often don't appear in lab tests but devastate field scores
Common Causes of Poor Core Web Vitals
LCP Failures (most common — 58% of failing pages):
- •Unoptimized hero images: Full-resolution JPEGs served to all devices without responsive sizing or modern formats
- •Slow server response (TTFB > 800ms): Uncached dynamic pages, distant origin servers, slow database queries
- •Render-blocking CSS/JS: Large stylesheets and synchronous scripts in
<head>that delay first render - •Missing preload hints: The LCP image not discovered early enough by the browser's preload scanner
- •Web font blocking: Custom fonts delaying text rendering (the LCP element is often a heading)
INP Failures (hardest to fix — requires JS expertise):
- •Long Tasks: JavaScript functions executing for 50ms+ without yielding to the main thread
- •Heavy event handlers: Click/scroll handlers doing too much synchronous work
- •Third-party scripts: Analytics, chat, social widgets, and ad scripts competing for main thread time
- •Excessive DOM size: Pages with 3000+ DOM nodes requiring expensive style recalculations on interaction
- •Framework hydration: React/Vue/Angular hydrating large component trees on page load, blocking interactions
CLS Failures (usually quickest to fix):
- •Images without dimensions:
<img>tags missing width/height attributes cause layout shifts when the image loads - •Dynamic content injection: Banners, cookie notices, and chat widgets inserted above existing content
- •Web font loading: Custom fonts with different metrics than fallback fonts causing text reflow
- •Ad slots without reserved space: Ads loading asynchronously and pushing content down
- •Late-loading CSS: Stylesheets loaded asynchronously that change element sizes after initial render
Platform-Specific Issues
WordPress: Plugin bloat is the #1 issue. The average WordPress site has 20+ plugins, each adding JavaScript and CSS. Common offenders: page builders (Elementor, Divi add 500KB–2MB of CSS/JS), social sharing plugins, slider plugins, and security plugins that add front-end scripts. Theme quality varies wildly — avoid themes with bundled plugins and heavy frameworks. See our WordPress Core Web Vitals guide for platform-specific fixes.
Shopify: App JavaScript accumulates silently. Each Shopify app injects scripts that persist even after the app is uninstalled. Shopify's Liquid rendering is synchronous, so theme complexity directly impacts TTFB. Dawn theme is well-optimized; older themes like Debut and Brooklyn are significantly slower.
WooCommerce: Combines WordPress's plugin issues with e-commerce complexity. Cart fragments AJAX (updating cart count in header) fires on every page load by default, adding 200–500ms. Product variation selectors can trigger heavy JavaScript on interaction. High product counts slow database queries. See our WooCommerce CWV guide.
React/Next.js/SPA: Client-side hydration is the primary INP killer. Large JavaScript bundles block the main thread during hydration. Solution: use React Server Components, Suspense boundaries, and dynamic imports. Next.js App Router with streaming SSR significantly improves LCP vs traditional client-side rendering.
Step-by-Step Optimization Guide: Quick Wins (Do These First)
These optimizations provide the highest impact with the least effort. Most can be implemented in under an hour each:
- 1Preload the LCP image: Identify your LCP element (usually hero image) and add
<link rel='preload' as='image' href='...' fetchpriority='high'>in the<head>. This alone can reduce LCP by 500ms–1.5s.
- 1Convert images to WebP/AVIF: Modern formats are 30–70% smaller than JPEG/PNG. Use an image CDN (Cloudinary, imgix) or build-time conversion. Serve with
<picture>for fallback.
- 1Add width/height to all images: Every
<img>tag needs explicit width and height attributes (or CSS aspect-ratio) to prevent layout shifts. This is the #1 CLS fix.
- 1Defer non-critical JavaScript: Move analytics, chat widgets, and marketing scripts to defer or async loading. Use Google Tag Manager's 'Container Loaded' trigger instead of 'All Pages.'
- 1Enable text compression: Ensure your server sends Brotli (preferred) or Gzip compression for HTML, CSS, and JS. This reduces transfer sizes by 60–80%.
- 1Set proper cache headers: Static assets should have Cache-Control: max-age=31536000, immutable. HTML should have short cache with revalidation. A CDN makes this much easier.
Optimizing LCP: Deep Dive
LCP optimization follows a systematic approach targeting the four sub-parts of LCP time:
- 1Reduce TTFB (Time to First Byte)
- •Use a CDN with edge caching (Cloudflare, Fastly, AWS CloudFront)
- •Enable server-side page caching (Redis, Varnish, or platform-specific caching)
- •Optimize database queries (add indexes, reduce query complexity)
- •Target: TTFB under 800ms on the 75th percentile
- 1Eliminate Render-Blocking Resources
- •Inline critical above-the-fold CSS (use tools like Critical or Penthouse)
- •Load remaining CSS asynchronously:
<link rel='preload' as='style' onload='this.onload=null;this.rel="stylesheet"'> - •Defer all JavaScript with the defer attribute
- •Remove unused CSS (PurgeCSS, UnCSS)
- 1Optimize the LCP Resource
- •Preload the LCP image:
<link rel='preload' as='image' fetchpriority='high'> - •Serve responsive images with srcset and sizes attributes
- •Use modern formats: WebP (30% smaller) or AVIF (50% smaller)
- •Compress aggressively: hero images rarely need quality above 75%
- 1Minimize Client-Side Rendering Delay
- •Avoid lazy-loading the LCP image (it should load eagerly)
- •Don't use JavaScript to insert the LCP element (breaks preload scanner)
- •Reduce main thread blocking before LCP with code splitting
- •Use SSR or SSG instead of client-side rendering for the initial viewport
Code example — optimal LCP image markup:
<link rel="preload" as="image" href="hero.webp" fetchpriority="high" />
<img src="hero.webp" alt="Descriptive alt text" width="1200" height="600" fetchpriority="high" decoding="async" />
Optimizing INP: Deep Dive
INP is the hardest CWV to optimize because it requires understanding JavaScript execution at a granular level.
- 1Break Long Tasks
Any JavaScript task running 50ms+ blocks the main thread and delays user interactions. Use yield-to-main patterns:
// Using scheduler.yield() (modern browsers)
await scheduler.yield();
// Fallback with setTimeout
function yieldToMain() {
return new Promise(resolve => setTimeout(resolve, 0));
}- 1Debounce Expensive Event Handlers
Scroll, resize, and input handlers should be debounced or throttled. Use requestAnimationFrame for visual updates and requestIdleCallback for non-urgent work.
- 1Defer Third-Party Scripts
Third-party scripts (analytics, chat, social) are the #1 cause of poor INP on most sites. Strategies:
- •Load after user interaction (scroll, click) instead of on page load
- •Use Partytown to run third-party scripts in a web worker
- •Evaluate each script's ROI — remove anything not actively providing value
- 1Reduce DOM Complexity
Pages with 3000+ DOM nodes require expensive style recalculations on every interaction. Virtualize long lists, remove hidden elements, and simplify component hierarchies.
- 1Optimize Framework Performance
- •React: Use React.memo, useMemo, useCallback to prevent unnecessary re-renders
- •Use startTransition for non-urgent state updates
- •Code-split routes and heavy components with React.lazy
- •Consider React Server Components to reduce client-side JavaScript
Optimizing CLS: Deep Dive
CLS is usually the quickest metric to fix, with most solutions being CSS-based:
- 1Explicit Image Dimensions
Every <img> and <video> must have width and height attributes. The browser uses these to calculate aspect ratio and reserve space before the resource loads.
- 1Font Loading Strategy
Custom fonts cause layout shifts when they swap with fallback fonts. The solution:
- •Use font-display: swap (or optional for non-critical text)
- •Add size-adjust, ascent-override, descent-override to the @font-face fallback to match the custom font's metrics
- •Preload critical fonts:
<link rel='preload' as='font' type='font/woff2' crossorigin>
- 1Reserve Space for Dynamic Content
Ads, embeds, and dynamically loaded content need reserved space:
- •Use min-height on ad containers matching the expected ad size
- •Use skeleton/placeholder UI for lazy-loaded content
- •Never insert content above existing visible content (e.g., sticky banners should push content down, not overlay)
- 1CSS containment
Use contain: layout on elements that shouldn't affect the layout of their siblings. This tells the browser that the element's internals won't cause external layout shifts.
- 1Avoid Intrinsic Size Changes
Don't animate width/height or top/left properties. Use transform and opacity for animations — they don't trigger layout recalculations and can't cause CLS.
Advanced Techniques for 2026
For sites already passing basic CWV thresholds, these advanced techniques push performance to the next level:
HTTP/3 with QUIC: Reduces connection setup time by 33% vs HTTP/2. Eliminates head-of-line blocking. Available on all major CDNs (Cloudflare, Fastly, AWS). Directly improves TTFB and LCP.
Partial Hydration: Frameworks like Astro, Qwik, and React Server Components dramatically reduce client-side JavaScript by only hydrating interactive components. A 60% reduction in JS bundle size is typical, directly improving INP.
Edge Computing: Cloudflare Workers, Vercel Edge Functions, and Deno Deploy bring server logic to the edge, achieving TTFB under 50ms globally. Combined with edge-side rendering, this virtually eliminates LCP issues.
Speculation Rules API: Enables instant navigations by pre-rendering likely next pages based on user behavior. Chrome supports speculative prerendering for same-origin links with configurable eagerness. This makes subsequent page loads appear instant.
View Transitions API: Provides smooth, native transitions between pages without JavaScript animation libraries. Combined with Speculation Rules, creates an app-like navigation experience while maintaining SEO benefits of multi-page architecture.
AI-Powered Image Optimization: Services like Cloudinary and imgix now use ML models to determine optimal compression per-image, achieving 20–30% smaller files than fixed-quality compression without visible quality loss.
Tools & Plugin Recommendations
WordPress Tools:
- •WP Rocket (Premium, $59/yr) — Best all-in-one: caching, critical CSS, lazy loading, database optimization
- •Perfmatters ($24.95/yr) — Script manager for disabling plugins per-page, local analytics, preloading
- •ShortPixel ($4.99/mo) — Bulk image optimization with WebP/AVIF conversion
- •Flying Scripts (Free) — Delays JavaScript execution until user interaction
- •Asset CleanUp (Free) — Removes unused CSS/JS per-page
Shopify Tools:
- •Theme optimization (manual) — Audit Liquid templates, remove unused sections
- •TinyIMG ($0-39/mo) — Image compression and lazy loading
- •Shopify's built-in Performance Dashboard — Monitors storefront speed
General Tools:
- •Cloudflare (Free–$200/mo) — CDN, auto-minification, HTTP/3, Polish image optimization
- •Cloudinary/imgix — Image transformation CDN with responsive delivery
- •Partytown (Free, open source) — Moves third-party scripts to web workers
- •Unlighthouse (Free, open source) — Batch Lighthouse scanning for entire sites
Monitoring:
- •SpeedCurve ($15–525/mo) — Continuous CWV monitoring with competitive benchmarking
- •DebugBear ($79–249/mo) — CrUX tracking, Lighthouse monitoring, alerts
- •Calibre ($45–500/mo) — Performance monitoring with budget enforcement
- •Web Vitals Chrome Extension (Free) — Real-time CWV overlay while browsing
Thresholds & Benchmarks
| Metric | Good | Needs Improvement | Poor |
|---|---|---|---|
| LCP (Largest Contentful Paint) | ≤ 2.5s | 2.5s – 4.0s | > 4.0s |
| INP (Interaction to Next Paint) | ≤ 200ms | 200ms – 500ms | > 500ms |
| CLS (Cumulative Layout Shift) | ≤ 0.1 | 0.1 – 0.25 | > 0.25 |
Key Measurement Tools
Google's primary tool — shows both CrUX field data and Lighthouse lab data. Best for quick diagnostics and sharing results with stakeholders.
CWV report for all indexed pages grouped by URL pattern. Best for monitoring site-wide health and identifying failing page templates.
Frame-by-frame execution traces with CPU profiling. Best for diagnosing specific bottlenecks and Long Tasks causing INP failures.
Full performance audit with actionable fix recommendations. Best for development workflow and CI/CD integration.
Advanced waterfall analysis, filmstrip comparison, multi-location testing. Best for detailed network-level debugging.
Historical Data Studio dashboard with CrUX trends over time. Best for tracking progress and demonstrating improvement to stakeholders.
Chrome extension showing real-time CWV as you browse your own site. Best for quick spot-checks during development.
Continuous monitoring platforms combining synthetic testing with CrUX field data. Best for enterprise-level tracking with alerting.
Looking for speed help?
Request An AuditStep-by-Step Optimization Guide
Audit current performance
Run PageSpeed Insights on your top 10–20 highest-traffic pages. Record LCP, INP, and CLS scores for both mobile and desktop. Check Google Search Console's CWV report for site-wide patterns. Identify which metric fails most often and which page templates are affected.
Fix LCP (highest impact)
Identify the LCP element on each failing page (PageSpeed Insights tells you). Preload it with <link rel='preload' fetchpriority='high'>. Convert to WebP/AVIF. Inline critical CSS and defer the rest. Reduce TTFB to under 800ms with CDN caching. Target: LCP ≤ 2.5s on mobile.
Fix CLS (quickest wins)
Add explicit width/height attributes to all <img> and <video> elements. Reserve space for ads and dynamic content with min-height. Use font-display: swap with size-adjusted fallback fonts. Remove content that loads above existing visible content. Target: CLS ≤ 0.1.
Fix INP (most complex)
Use Chrome DevTools Performance panel to find Long Tasks (50ms+). Break them with yield-to-main patterns. Debounce event handlers. Defer third-party scripts until user interaction. Reduce DOM size below 1500 nodes. Code-split heavy JavaScript. Target: INP ≤ 200ms.
Optimize images globally
Convert all images to WebP (with JPEG fallback). Implement responsive images with srcset and sizes. Lazy-load all images except the LCP element. Compress to quality 75–80% (rarely visually noticeable). Use an image CDN for automatic format negotiation.
Audit third-party scripts
List every third-party script loading on your pages (Chrome DevTools → Network → filter third-party). Measure each script's impact by blocking it and re-testing. Remove unused scripts, defer non-essential ones, and consider Partytown for analytics/marketing scripts.
Deploy and monitor field data
Deploy all changes. Set up continuous monitoring with Google Search Console CWV report. Wait 28 days for CrUX data to fully reflect improvements. Compare before/after field data. Set performance budgets to prevent regression. Schedule quarterly re-audits.
Want us to handle these optimizations?
Request an audit for your Core Web Vitals site and see results in days, not months.
Real-World Case Studies
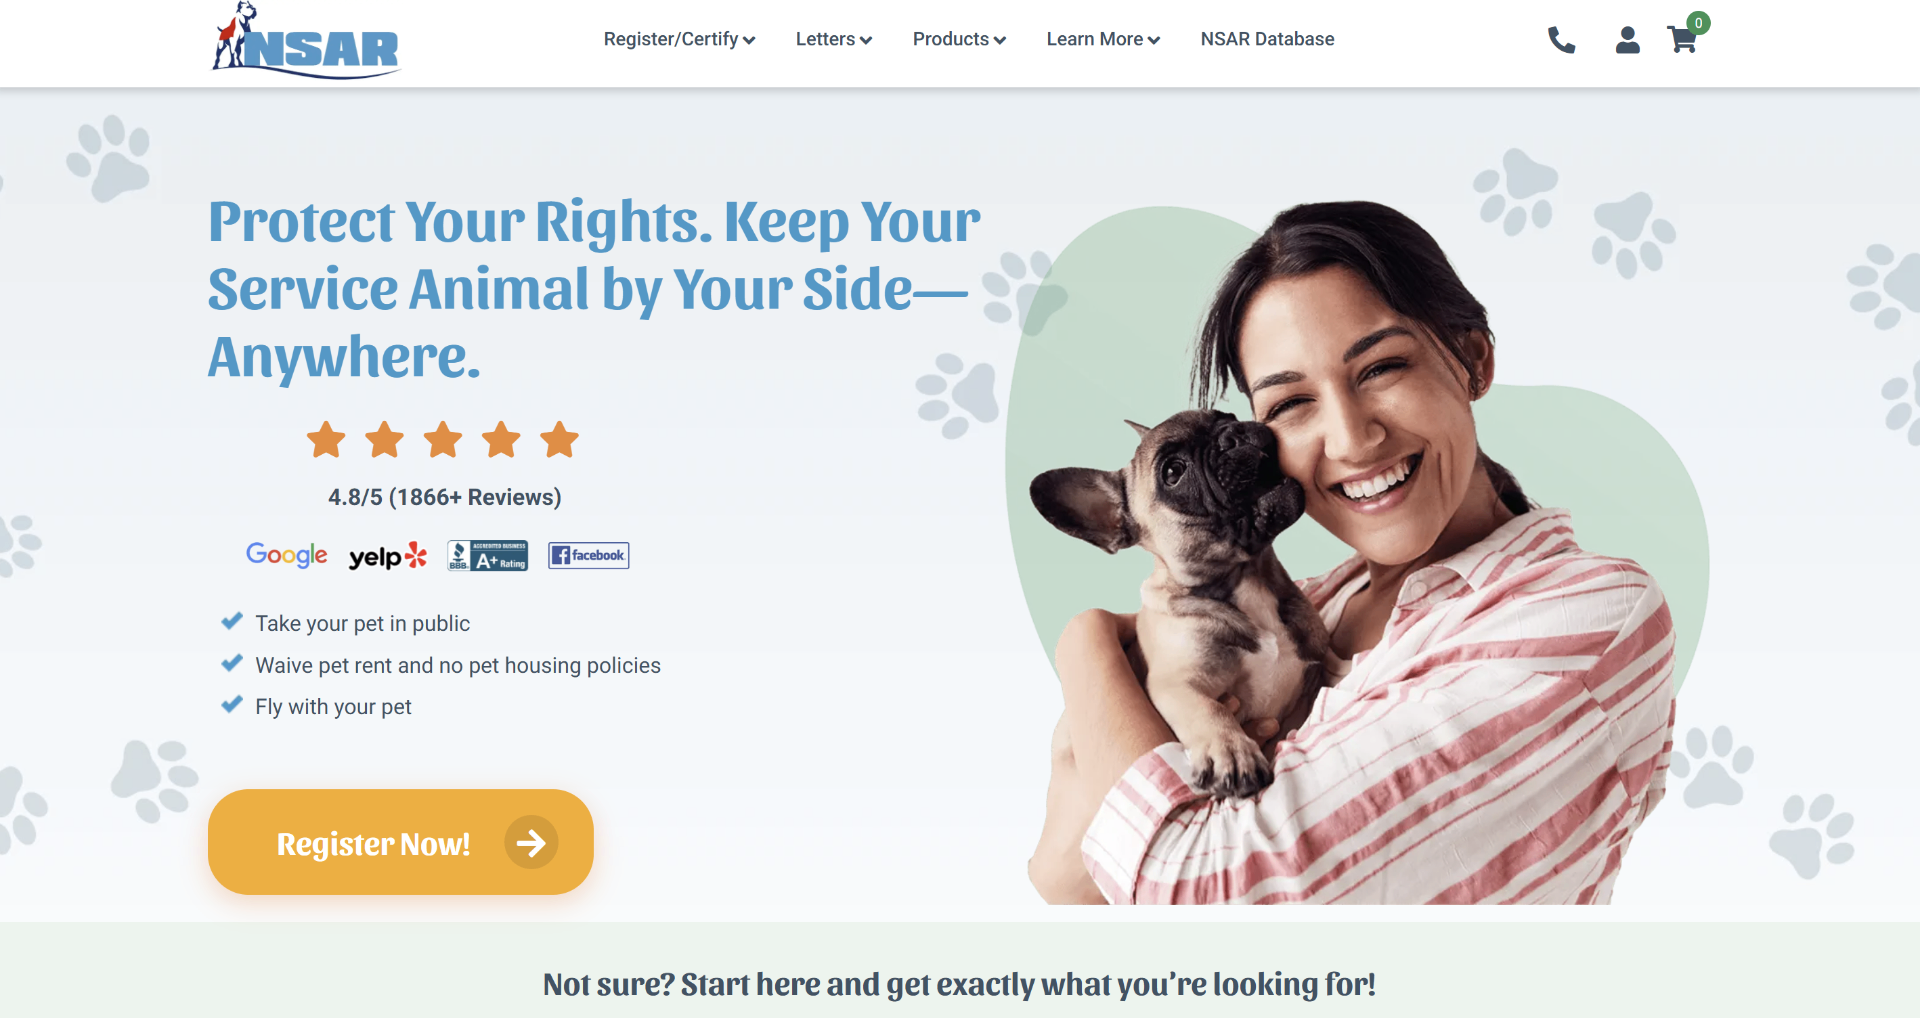
Service Animal Support | < 10 Employees
How We Helped National Service Animal Registry Improve Site Speed and Pass Core Web Vitals
Read Case Study
Lifestyle & Content | < 10 Employees
Plugin Reduction & Template-Level CWV Optimization for Content-Heavy WordPress Site
Read Case Study
Health & Wellness | < 50 Employees
How We Helped Her Fantasy Box Improve Site Speed by 300% and Pass Core Web Vitals
Read Case StudyCore Web Vitals in 2026: Updates & Future Trends
Looking ahead to late 2026 and beyond, several trends will shape CWV evolution:
Potential Fourth Metric — Smoothness: Google has signaled interest in adding a 'smoothness' or 'animation fluidity' metric measuring scroll jank and animation frame drops. This would particularly impact media-rich sites and SPAs with heavy scroll interactions.
Speculation Rules API Adoption: As Chrome's Speculation Rules API matures, pre-rendering likely next pages will become standard practice, effectively eliminating LCP for subsequent page loads. This shifts optimization focus to the initial landing page.
AI-Powered Auto-Optimization: Tools like Vercel's Speed Insights and Cloudflare's Auto-Minify are adding ML-driven optimization that automatically applies fixes. Expect CMS platforms to bake in CWV optimization as a default feature.
Edge-First Architecture: The shift toward edge computing (Cloudflare Workers, Deno Deploy, Vercel Edge) is making sub-50ms TTFB achievable globally. Combined with streaming SSR, this fundamentally changes the LCP optimization landscape.
Continued Pass Rate Improvement: The HTTP Archive shows steady improvement — from 28% of mobile origins passing all CWV in 2021 to 42% in 2025. By late 2026, this is projected to reach 48–50%. The competitive advantage of passing CWV narrows as more sites optimize, making it increasingly important to pass just to maintain parity.
Need help with Core Web Vitals speed?
Our team specializes in Core Web Vitals performance optimization. Request an audit and see exactly how much faster your site could be.
View Optimization ServiceFrequently Asked Questions
Core Web Vitals are three specific user experience metrics (LCP, INP, CLS) that Google uses as ranking signals. They measure loading performance, interactivity/responsiveness, and visual stability of web pages using real-user data from Chrome browsers.
Yes. Core Web Vitals have been a confirmed Google ranking factor since June 2021 and remain so in 2026. Google uses them as a tiebreaker when content relevance between competing pages is similar.
Interaction to Next Paint (INP) replaced First Input Delay (FID) in March 2024. INP is more comprehensive — it measures all user interactions throughout the page lifecycle, not just the first one.
A good LCP score is 2.5 seconds or less, measured at the 75th percentile of real users over a 28-day rolling window. This means 75% of your visitors need to experience LCP under 2.5s for Google to consider it 'good.'
A good INP score is 200 milliseconds or less. INP measures how quickly your page responds to user clicks, taps, and keyboard inputs. It's the hardest CWV to optimize because it requires JavaScript performance tuning.
A good CLS score is 0.1 or less. CLS measures unexpected layout shifts — when visible content moves without user interaction. It's usually the quickest metric to fix by adding image dimensions and reserving space for dynamic content.
No. Lighthouse provides lab data (simulated testing). Google uses field data from real Chrome users (CrUX) for ranking. Lighthouse is valuable for debugging and finding optimization opportunities, but your Lighthouse score doesn't directly determine rankings.
CrUX data uses a 28-day rolling window, so improvements take at least 28 days to fully reflect in field data. After that, Google needs to crawl and re-evaluate your pages. Total timeline: expect 4–8 weeks from deploying fixes to seeing ranking impact.
Yes. Google factors landing page experience (including CWV) into Quality Score for Google Ads. Faster landing pages = higher Quality Score = lower cost-per-click. We've seen clients reduce CPC by 12–18% after passing CWV.
Technically yes, if its content is significantly more relevant than competitors. CWV is a tiebreaker, not the primary ranking factor. But in competitive niches where multiple pages have similar content quality, CWV can be the deciding factor.
Fix LCP first — it fails most often and has the most visible impact on user experience. Then fix CLS (usually quickest). Fix INP last (most complex, requires JavaScript expertise).
Google uses mobile CWV data for mobile search results and desktop data for desktop results. Since mobile scores are typically worse and mobile searches dominate (60%+), prioritize mobile optimization.
Use PageSpeed Insights for quick checks of both field and lab data. Use Google Search Console for site-wide CWV monitoring of all indexed pages. Use Chrome DevTools for debugging specific issues.
The most common causes on Shopify are: unoptimized hero/product images (not WebP, not responsive), excessive app JavaScript (each app adds scripts), render-blocking theme CSS, and slow Liquid template rendering from theme complexity.
Common WordPress LCP issues: unoptimized images (no WebP, no lazy loading except LCP), plugin bloat (each plugin adds CSS/JS), render-blocking resources from poorly coded themes, missing critical CSS, and slow server response from uncached dynamic pages.
Google evaluates CWV at the 75th percentile (p75) of real-user data over 28 days. This means 75% of your visitors must have 'good' scores for the page to pass. It's stricter than the median — even if most users have good experiences, a significant minority with poor experiences will cause failure.
It's possible but significantly harder. Page builders add substantial CSS/JS overhead (500KB–2MB). Strategies: use the builder's performance features, minimize widgets per page, enable built-in lazy loading, and use a caching plugin with critical CSS generation.
Third-party scripts (analytics, chat widgets, ads, social embeds) compete for main thread time, increasing INP. They can also inject content that causes CLS. Each script typically adds 100–500ms of processing time. Audit, defer, or remove scripts that don't provide measurable business value.
Field data comes from real Chrome users (via CrUX) — it's what Google uses for rankings. Lab data comes from simulated tests (Lighthouse, WebPageTest) — it's useful for debugging. Always validate with field data; lab scores can be misleading.
Yes, significantly. Research shows every 100ms improvement in LCP can increase conversions by up to 8%. Sites passing all CWV see 24% fewer abandonments. For a $100K/month store, improving from 'poor' to 'good' CWV can mean $8K–$15K in additional monthly revenue.
CDNs reduce Time to First Byte (TTFB) by serving content from edge servers close to users, directly improving LCP. They also enable HTTP/3, automatic compression, and image optimization. Cloudflare's free tier alone can reduce TTFB by 40–60%.
INP has three components: 1) Input delay — time the main thread is busy when the user interacts. 2) Processing time — how long event handlers take to execute. 3) Presentation delay — time to render the next frame after handlers complete. All three must be optimized for good INP.
No — never lazy-load the LCP image (hero image, main product image). Lazy-loading the LCP image delays it, worsening LCP. Lazy-load all other below-fold images. Use loading='lazy' on non-LCP images and fetchpriority='high' on the LCP image.
Use font-display: swap in your @font-face declaration. Add size-adjust, ascent-override, and descent-override properties to match your fallback font's metrics to the custom font. Preload critical fonts with <link rel='preload' as='font' crossorigin>.
Yes. SPAs typically have worse INP due to heavy client-side JavaScript and hydration. CWV only measures the initial page load for traditional navigation — soft navigations (client-side routing) are being experimented with for future CWV measurement. Use SSR/SSG for the initial load.
Absolutely. Hosting directly affects TTFB, which impacts LCP. Shared hosting on distant servers can add 500ms–2s to TTFB. Use a hosting provider with edge caching, SSD storage, and HTTP/2+ support. The best approach: CDN for static assets + optimized origin for dynamic content.
Monitor continuously via Google Search Console (check weekly). Run full performance audits quarterly, or after any major site change (redesign, new features, plugin updates). Set up performance budgets in CI/CD to catch regressions before they reach production.
Three highest-impact quick wins: 1) Preload + optimize the LCP image (WebP, correct dimensions, fetchpriority='high'). 2) Add width/height to all images (fixes CLS). 3) Defer non-essential third-party scripts (improves INP). These three changes alone can move many sites from 'poor' to 'needs improvement' or 'good.'